Continuing to make it easier for Enterprise customers to upgrade to Internet Explorer 11 — and Windows 10

Fred and I discuss Enterprise Mode on the Microsoft Edge blog:

Helping our Enterprise customers stay up-to-date with the latest version of the browser is a top priority for Microsoft. This is particularly important for Windows 7 customers who should upgrade to Internet Explorer 11 by January 12, 2016 to continue receiving security updates and technical support. We understand many customers have web apps and services designed specifically for older versions of Internet Explorer, so we’re continuing to improve our set of Enterprise Mode tools to help you run those applications in Internet Explorer 11. Upgrading to Internet Explorer 11 can ease the upgrade to Windows 10, too, since Internet Explorer 11 is supported on Windows 7, Windows 8.1, and Windows 10.

Continuing to improve Enterprise Mode

We continue to make significant improvements to Enterprise Mode, helping customers upgrade more easily to Internet Explorer 11 while also extending the ability to run older web apps. Customer feedback has told us that we’re on the right track with these tools, and that IE upgrades are going more smoothly than ever before.

Here are some features and resources available for you today:

IE8 Enterprise Mode
IE8 Enterprise Mode provides a higher fidelity emulation of the Internet Explorer 8 browser by turning on functionality not available in other document modes. You can use the Enterprise Mode Site List Manager to specify any web path to load in this mode.

IE7 Enterprise Mode
Internet Explorer 8 shipped with Compatibility View, a compatibility option that looks for the DOCTYPE tag, rendering a web page in IE7 document mode if it exists, or in IE5 document mode if it doesn’t.

While IE11 still has Compatibility View, you can use IE7 Enterprise Mode to provide a higher fidelity emulation of how the IE8 browser acts when running in Compatibility View. You can use the Enterprise Mode Site List Manager to specify any web path to load in this mode.

IE5, IE7, IE8, IE9, IE10, and IE11 Document Modes
Internet Explorer 11 supports document modes for emulation of the IE5, IE7, IE8, IE9, IE10, and IE11 rendering engines. While site markup can request the browser to load in these modes, you can also use the Enterprise Mode Site List to override the site to load in any document mode that makes the site work.

Enterprise Site Discovery
If you want to prioritize your testing, you can use Enterprise Site Discovery with IE8, IE9, IE10, and IE11 to discover which web apps your users are visiting and how the apps are built, like what document mode or ActiveX Controls are used. The Enterprise Mode Site List Manager tool can even import this data to help you seed your Enterprise Mode Site List. Of course, using the F12 developer tools for manual testing is always an option, but Enterprise Site Discovery can help you quickly gather information from a broad set of users.

(New!) Support for HTTP ports in Enterprise Mode
We’ve also heard from many customers that they want the ability to apply Enterprise Mode compatibility features to sites with HTTP ports, such as http://contoso.com:8080, and we’ve listened: Enterprise Mode now supports HTTP ports. You can specify a HTTP port directly in your Enterprise Mode Site List XML, such as <domain>contoso.com:8080</domain>, or you can use the new Enterprise Mode Site List Manager tool to add HTTP ports. To use this feature on Windows 7 or Windows 8.1, you’ll need to also install the IE11 October Cumulative Update or later.

(New!) Web Application Compatibility Lab Kit
To help customers learn how to use Enterprise Mode and Enterprise Site Discovery, today we are introducing the Web Application Compatibility Lab Kit. This Lab Kit provides a walk-through of how to configure and set up Enterprise Mode in addition to Enterprise Site Discovery, the F12 developer tools, and the Enterprise Mode Site List Manager. The Lab Kit comes with VMs for Windows 7 SP1 Enterprise (Evaluation) and Windows 10 Enterprise (Evaluation), or you can download a “lite” version without the VMs.

For more information or assistance:

New improvements to Enterprise Mode in Windows 10

We’re also making it easier for customers to upgrade to Windows 10, because Windows 10 supports the same version of Internet Explorer 11—along with all of the Enterprise Mode features—available on Windows 7 and Windows 8.1. At the same time, we’ve continued to make improvements to Enterprise Mode in the Windows 10 Fall Update and higher to simplify management and better support Microsoft Edge. Many of these improvements will also be made available to Internet Explorer 11 on Windows 7 and Windows 8.1 early next year.

Microsoft Edge and IE11 work better together on Windows 10

Windows 10 features Microsoft Edge, a new browser that goes beyond browsing with features like Web Note and Cortana integration. Microsoft Edge is built from the ground up to improve productivity, to be more secure, and to correctly, quickly, and reliably render web pages. As we announced a few months ago, you can use Enterprise Mode with Microsoft Edge to open Internet Explorer 11 for your business’s sites that require IE proprietary technologies. This approach enables your users to run a modern browser designed for better productivity, security, and rendering web pages—without sacrificing compatibility with legacy line of business applications.

However, we also recognize that some customers have a significant number of sites that require IE proprietary technologies, and still need to use Internet Explorer 11 as their primary browser. For those customers, we have introduced a new capability in Enterprise Mode for Internet Explorer 11 to open Microsoft Edge for modern sites that need the latest web platform features. This feature has a very similar user experience to the analogous feature in Microsoft Edge to open IE11.

In this example below, we’ve setup Enterprise Mode with IE11 to open http://www.bing.com in Microsoft Edge.

Screen capture showing Internet Explorer 11 prompting the user to open a site in Internet Explorer 11.

With this change, customers now have the following options for browsers on Windows 10:

Use Microsoft Edge as your primary browser If your business sites primarily use modern web technologies, we recommend that you use Microsoft Edge as your primary browser.
Use Microsoft Edge as your primary browser and use Enterprise Mode to open sites in IE11 that use IE proprietary technologies If your business sites primarily use modern web technologies but you still have older sites that use IE proprietary technologies, we recommend that you use Microsoft Edge as your primary browser and use the Enterprise Mode Site List to open older sites automatically in Internet Explorer 11. This approach helps ensure your new site development continues to happen on a modern web platform, but that you can still use your older apps that were designed for older versions of IE. Your Enterprise Mode Site List also becomes a to-do list for sites that you need to modernize. Many customers tell us they plan to use this approach. We use this option at Microsoft, since we still have some older applications built for older IE technologies.
Use Microsoft Edge as your primary browser and open all intranet sites in IE11 If you have external sites that use modern web technologies, but still have a large number of internal business sites that use IE proprietary technologies, you can choose to use Microsoft Edge as your primary browser and open all intranet sites in IE11 using the Sends all intranet traffic over to Internet Explorer Microsoft Edge Group Policy or MDM setting. You can still use the Enterprise Mode Site List to ensure the internal sites that work with Microsoft Edge don’t open in IE11. This approach helps ensure your new site development continues to happen on a modern web platform, but balances it with your need to continue using older apps that were designed for older versions of IE.
Use IE11 as your primary browser and use Enterprise Mode to open sites in Microsoft Edge that use modern web technologies If you have more business sites built on IE proprietary technologies than modern web technologies, you can choose to use IE11 as your primary browser and use the Enterprise Mode Site List to explicitly define the modern web sites that should open automatically in Microsoft Edge. This approach helps ensure your new site development continues to happen on a modern web platform engine in Microsoft Edge, while balancing the fact that most of your web apps are still based on IE.
Use IE11 as your primary browser If you want the exact same environment on Windows 10 as on Windows 7 or Windows 8.1, you can choose to use IE11 as your primary browser. You can set IE11 as your default browser by using the Set a default associations configuration file in the File Manager Group Policy. While this is a great approach to quickly get to Windows 10, we recommend that customers consider using Microsoft Edge as a more secure, reliable browser instead. Developing new business applications using IE proprietary technologies could also make it harder for you to adopt modern web technologies in the future.

Simpler, cleaner, and more scalable Enterprise Mode XML schema

We’ve heard that most customers are using the Enterprise Mode Site List to upgrade to IE11 on Windows 7, and will likely continue to use the site list going forward. We’ve also heard feedback that the existing site list XML schema isn’t always very easy to understand. Starting in the Windows 10 Fall Update, we’re now supporting a new v.2 Enterprise Mode XML schema, which is designed to be simpler, cleaner, more scalable, and to help ease list management. Internet Explorer 11 and Microsoft Edge on Windows 10 will continue to support the existing v.1 XML schema that is supported on Windows 7 and Windows 8.1 today, as well as the new v.2 XML schema.

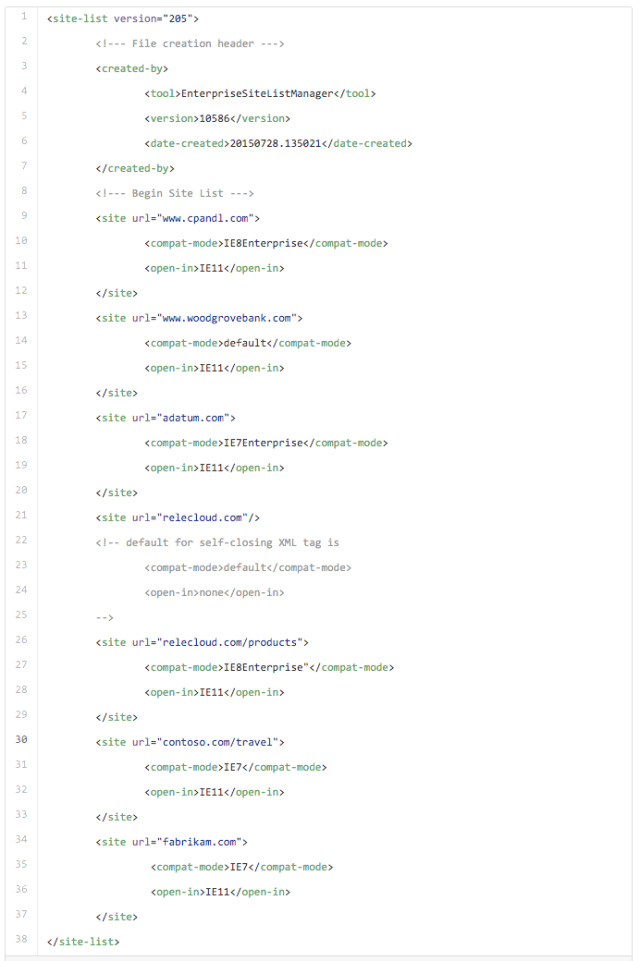
Below is an example of an Enterprise Mode Site List based on the existing v.1 XML schema. Customer feedback included:

  • It’s not clear that if the same entry appears in the emie and docMode sections, the emie section wins.
  • The double negative of doNotTransition=”false” is confusing.
  • There are many ways to put a site in a document mode: entry in emie section, entry in docMode section, or forceCompatView attribute.
  • You have to break up an URL into the domain and paths separately for the emie and docMode sections.

EMIE v1 schema

Below, we have the same Enterprise Mode Site List using the v.2 XML schema. Here are some of the changes:

  • All entries are just URLs under the site element. This reduces the hierarchy and the need to split sites into domains and paths.
  • We’ve introduced a new compat-mode element where you can specify any compatibility mode: IE8Enterprise, IE7Enterprise, IE5, IE7, IE8, IE9, IE10, IE11, and default. This attribute replaces the emie and docMode sections, and forceCompatView and exclude attributes.
  • We’ve introduced a new open-in element where you can specify which browser the site should open in: IE11, MSEdge, or none (don’t open in another browser). This replaces the double negative of doNotTransition=”false”.
  • You can use a self-closing element with no children to declare a site should just use the browser defaults. This replaces the exclude attribute.
  • We include the date the list was created and the Enterprise Mode Site List Manager tool version number for easier site list version management. This information doesn’t impact how the browser interprets the site list.
  • This format makes it very easy for us to introduce new Enterprise Mode features as children elements to the site element.

EMIE v2 schema

We encourage customers to adopt the easier to read and manage v.2 version of the XML schema, starting with Windows 10 and coming in early 2016 to IE11 on Windows 7 and Windows 8.1. Going forward, we plan to bring new features only to the v.2 XML schema. For example, the new Enterprise Mode feature for IE11 to open sites in Microsoft Edge is only supported with the new v.2 XML schema.

Here is an example of how you can specify that IE11 open a site in Microsoft Edge:

OpenInEdge

In addition to the new v.2 version of the XML schema, we’re also supporting a new version of the Enterprise Mode Site List Manager tool for Windows 10. This version of the tool lets you import an existing v.1 Enterprise Mode Site List XML file and automatically convert it to the v.2 XML schema.

Important note:
To avoid adding extra work to migrate from the v.1 to v.2 XML schema while customers are trying to upgrade to IE11 on Windows 7 and Windows 8.1 before the January 12, 2016 support policy deadline, we’ve decided to wait before supporting the v.2 XML schema on Windows 7 or Windows 8.1 today. We recommend customers working on IE11 upgrades on Windows 7 and Windows 8.1 continue to use the existing v.1 XML schema and the existing Enterprise Mode Site List Manager tool for Windows 7 and Windows 8.1 Update. The existing schema continues to be supported on all versions of Windows where IE11 is supported, including Windows 10. We will make the v.2 Enterprise Mode XML available in Internet Explorer 11 for Windows 7 and Windows 8.1 early next year, and customers shouldn’t consider moving to the v.2 XML schema until that patch lands on all of their devices.

To learn more about this Enterprise Mode XML schema changes, see the following:

Better diagnostics and management with about:compat

In the Windows 10 Fall Update, we’ve also introduced a new about:compat page in Microsoft Edge and Internet Explorer 11 to help customers better manage their Enterprise Mode Site List. You can use about:compat to see all of the compatibility features you or Microsoft have applied to sites on the client machine. This tool is not only an easy way to visualize and search the Enterprise Mode Site List, but a great way to diagnose problems on a client machine, like whether the latest Enterprise Mode Site List is being applied.

On Internet Explorer 11 for Windows 10, you can view and search the Enterprise Mode Site List, local additions to the Enterprise Mode list, the Microsoft Compatibility List, and local additions to Compatibility View.

Screen capture showing the about:compat interface in Internet Explorer 11 on Windows 10.

On Microsoft Edge, you can view and search the Enterprise Mode Site List and Microsoft Compatibility List, as only those lists are applicable.

Screen capture showing the about:compat interface in Microsoft Edge

Upgrade guidance

Migrating to Internet Explorer 11 is easier than ever before, thanks to backward compatibility features like Enterprise Mode. Please start with the resources in this post, such as the Web Application Compatibility Lab Kit, to learn how to use Enterprise Mode and Enterprise Site Discovery effectively. If you still have a technical or business impediment that prevents you from upgrading, please reach out to your Microsoft account team or Microsoft partner, as we may be able to help.

We made these product improvements and upgrade resources based on customer feedback, and hope the new features help you manage browser compatibility more easily than ever before. Like other customers, you may also find that upgrading to Internet Explorer 11 with Enterprise Mode is easier and less costly than previous upgrades. Best of all, the upgrade to Internet Explorer 11 should help ease your migration to Windows 10 and Microsoft Edge.

– Jatinder Mann, Senior Program Manager Lead
– Fred Pullen, Product Marketing Director

Advertisement

Internet Explorer Performance Lab: reliably measuring browser performance

Matt, Jason and I wrote this article on the Building Windows 8 engineer blog on how the Internet Explorer team measures web browing performance. PC Magazine discusses the article as well. Enjoy!

A big part of this blog is going behind the scenes to show you all the work that goes into the engineering of Windows 8.  In this post we take a look at something we all care very deeply about–as engineers and as end-users–real world web performance. We do a huge amount of work to get beyond the basics of anecdotes and feel as we work to build high performance web browsing.  This post is authored by Matt Kotsenas, Jatinder Mann, and Jason Weber on the IE team, though performance is something that every single member of the team works on.
–Steven Sinofsky, President of Windows and Windows Live.

Web performance matters to everyone, and one engineering objective for Internet Explorer is to be the world’s fastest browser. To achieve this goal we need to reliably measure browser performance against the real world scenarios that matter to our customers.

Over the last five years we designed and built the Internet Explorer Performance Lab, one of the world’s most sophisticated web performance measurement systems. The IE Performance Lab collects reliable, accurate, and actionable data to inform decisions throughout the development cycle. We measure the performance of Internet Explorer 200 times daily, collecting over 5.7 million measurements and 480GB of runtime data each day. We understand the impact of every change to the product and ensure that Internet Explorer only gets faster. This blog post takes a deep look at how the IE Performance Lab is designed and how we use the lab to ensure we’re continually making the web faster.

In this post, we present:

  • Overview of the IE Performance Lab
  • Lab infrastructure
  • What (and how) we measure
  • Testing a scenario
  • Results investigation
  • Testing third-party software
  • Building a fast browser for users

Overview of the IE Performance Lab

In order to reliably measure web performance over time, a system needs to be able to reproducibly simulate real world user scenarios. In essence, our system needs to create a “mini version of the Internet.”

The IE Performance Lab is a private network completely sealed from both the public Internet and the Microsoft intranet network, and contains over 140 machines. The lab contains the key pieces of the real Internet, including web servers, DNS servers, routers, and network emulators, which simulate different customer connectivity scenarios.

Although this may appear complex at first glance, this approach allows all sources of variance to be removed. By controlling every aspect of the network, down to individual packet hops and latencies, our tests become deterministic and repeatable, which is critical to making the results actionable. In the IE Performance Lab, activity is measured with 100 nanosecond resolution.

Diagram shows content servers connected to Network emulators, connected to DNS servers, connected to Test clients, connected to Raw data storage, connected to Data analysis, connected to SQL database.

This type of network configuration also provides a great amount of flexibility. Because we’re simulating a real world setup, our lab can accommodate nearly any type of test machine or website content. The IE Performance Lab supports desktops, laptops, netbooks, and tablets with x86, x64, and ARM processors, all simultaneously.

Similarly, because the lab uses the Windows Performance Tools (WPT), we can run the same tests using different web browsers, toolbars, anti-virus products, or other third-party software and directly compare the results. WPT provides deep insight into the underlying hardware. Using WPT, we can capture everything from high-level CPU and GPU activity, to low-level information such as cache efficiency, networking statistics, memory usage patterns, and more. WPT allows us to measure and optimize performance across the stack to ensure that the hardware, device drivers, Windows operating system, and Internet Explorer are all efficiently optimized together.

A single test run takes 6 hours to complete and generates over 22GB of data during that time. This highly automated system is staffed by a small team that monitors operations, analyzes results, and develops new infrastructure features.

Lab infrastructure

The Performance Lab infrastructure can be broken into three main categories: Network and Server, Test Clients, and Analysis and Reporting. Each category is designed to minimize interaction across components, both to improve scalability of testing and to reduce the possibility of introducing noise into the lab environment.

A large room full of computers

Here’s a view of the IE Performance Lab, including a number of test and analysis machines on our private network.

Network and server infrastructure

Let’s start by discussing the DNS servers, network emulators, and content servers; all the components that together create the mini Internet. Over the next three sections we’ll work our way from right to left in the architectural diagram.

Content servers

Content servers are web servers that stand in for the millions of web hosts on the Internet. Each content server hosts real world web pages that have been captured locally. The captured pages go through a process we refer to as sanitization, where we tweak portions of the web content to ensure reproducible determinism. For example, JavaScript Date functions or Math.Random() calls will be replaced with a static value. Additionally, the dynamic URLs created by ad frameworks are locked to the URL that was first used by the framework.

After sanitization, content is served similarly to static content through an ISAPI filter that maps a hash of the URL to the content, allowing instantaneous lookup. Each web server is a 16-core machine with 16GB of RAM to minimize variability and ensure that content is in memory (no disk access required).

Content servers can also host dynamic web apps like Outlook Web Access or Office Web Apps. In these cases, the application server and any multi-tier dependencies are hosted on dedicated servers in the lab, just like real world environments.

Network emulators

Since many sources of variability have been removed, network speeds no longer reflect the experiences of many users with slower connections. To simulate real world customer environments, a test can take advantage of network emulation to understand the performance across the wide range of networks in use today. The lab supports emulating several DSL configurations, cable modems, 56k modems, as well as high-bandwidth, high-latency environments like WAN and 4G environments. As HTTP requests are passed to the emulator, it simulates network characteristics like packet delay and reordering, then forwards the request on to the web hosts. Upon receiving a response, emulation is again applied and then passed back to the test client.

Using dedicated hardware for network emulation provides the most realistic testing environment possible, and significantly reduces the observer effect. Although dedicated hardware adds cost and complexity compared to proxy or software-based solutions, it’s the only way to accurately measure performance. Browsers limit the number of simultaneous proxy connections to prevent proxy saturation, so using a proxy for network emulation has the unintended effect of sidestepping domain sharding and other optimizations made by the webpage. Additionally, local network emulation will compete with the browser for local machine resources, especially on low power machines.

DNS servers

Like real world DNS servers, the lab’s DNS servers link the content servers to the test clients. The lab also uses a different DNS server for each network emulator, meaning that changing from one network speed to another is as simple as changing the DNS server. In these cases, instead of resolving domain names to the web hosts, the DNS server resolves all domain names to the associated network emulator.

Test client configurations

We want to ensure that Internet Explorer consistently runs fast across all classes of computer hardware. The lab contains over 120 computers used to measure Internet Explorer performance. We refer to these as test clients; they range from high-end x64 desktops, to low-powered netbooks, to touch-first tablet devices, and everything in between. Because repeatability of measurements is paramount, all test clients are physical machines.

A long desk and two shelves, each containing 12 or more computers

Internet Explorer Performance Lab change comparison machine pool

Different machine classes contain both discrete and integrated graphics platforms to ensure that Internet Explorer continues to take full advantage of hardware acceleration across the ecosystem of devices. Above is our main machine pool. These PCs approximate the average consumer experience over the lifetime of a Windows 7 or Windows 8 PC.

Machines are ordered from the OEM to be identical; they all come from the same manufacturing lot and their performance characteristics are verified prior to use. Since the lab runs 24/7, hardware failures are inevitable. Replacing failed components with identical parts from a different manufacturing lot almost always results in the repaired computer running faster than the other machines in the pool. While this difference would be unnoticeable in the real world, when you’re measuring down to 100 nanoseconds, even a few cycles can impact the results! If after a repair a machine no longer runs identically to the rest of the pool, it is removed from the lab and the pool’s size permanently shrinks. In response, the lab’s purchases include extra “buffer” machines, so that when a failed machine is removed from the pool, the excess capacity provides a cushion, and the lab’s operations are not affected.

To add hardware breadth, we have additional machine pools that run the spectrum of consumer scenarios. Good performance on these machines ensures that IE uses the underlying hardware effectively across the PC ecosystem.


Assortment of laptop and desktop PCs on two shelves

Low-powered test machines. Each one is in a different state of testing.

If even more diversity is needed, the IE Performance Lab can also make use of the Windows Graphics Lab. The Windows Graphics Lab stocks nearly every graphics chipset manufactured. PCs can be configured into nearly any permutation imaginable and then used for performance testing. The Windows Graphics Lab is invaluable for diagnosing graphics problems across chipsets and driver revisions.

Analysis and reporting servers

Collection and analysis of test results are divided into two separate steps. By offloading analysis to dedicated machines, the test clients can begin another performance run earlier, and more powerful server class machines can be used to perform the analysis more rapidly. The sooner the analysis completes, the more efficiently we can identify performance changes.

For analysis, we use 11 server class machines, each of which has 16 cores and 16GB of RAM. During analysis, each trace file is inspected and thousands of metrics are extracted and inserted into a SQL server. Over the course of 24 hours these analysis machines will inspect over 15,000 traces that will be used for trend analysis.

Two server racks

Pictured are two of several server racks which contain file servers, a SQL server, and several analysis and content servers.

The SQL Server used to store the nearly 6 million measurements we collect each day is a 24 logical core machine with 64GB of RAM. Reports can be generated directly from SQL, or results can be inspected using either an HTML-based comparison application or WCF service that provides results in XML or JSON formats.

What (and how) we measure

With the infrastructure in place, let’s review the different types of scenarios measured in the Performance Lab, and the tools we use to gather metrics.

Scenarios measured daily

The Performance Lab focuses on real world scenarios that matter to users. As a result, we run over 20,000 different tests daily. These tests fall into four, sometimes overlapping, categories:

4 overlapping circles: Loading Content, Interactive Web Apps, IE "The Application", Synthetic Platform Benchmarks

Loading content – Navigating from one page to another is still the

most common activity inside a web browser. Loading web content is also the only

category that touches most of the browser’s eleven subsystems. Loading web content is a prerequisite

for the other categories of scenarios.

Interactive web apps – This category covers what is sometimes referred

to as content creation, AJAX applications, or Web 2.0 sites. It includes interacting

with popular news and social networking sites as well as interacting with mail and document applications like Outlook Web Access and Office Web Apps.

IE “the application” – Important but often forgotten are scenarios that interact with the browser itself. Common interactions include opening or closing the browser, switching tabs, using browser features like History and Favorites, and panning and zooming with both keyboard and mouse, and touch inputs.

Synthetic benchmarks – Rarely forgotten but often overstated are synthetic benchmarks like WebKit SunSpider. Benchmarks can be a useful engineering tool as they are designed to stress individual browser subsystems and accentuate differences between browsers. However, in order to maximize those differences, benchmarks often resort to atypical usage patterns or edge cases.

Real world patterns

When measuring performance it is important to ensure that the tests reflect real world usage patterns. Most Software Engineering textbooks refer to this process as workload

modeling, or application usage modeling. To ensure that the Performance Lab measures real world patterns, the Performance Lab uses real Web pages that represent real world patterns and exercise different browser subsystems.

In order to determine which sites to use for testing, we regularly crawl millions of sites and compile a list of site attributes and coding patterns. We use 68 different data points to determine commonalities across sites – things like the depth and width of the resulting DOM, CSS layout patterns, common frameworks used, international features, and more. From the results we chose sites that best represent the common patterns and diversity of the broader Web.

Engineering metrics

Performance is a multi-dimensional problem. The only way to get an accurate view of performance is to understand the scenario you’re testing, and how the hardware and OS interact with the browser. Here’s a closer look at five important performance metrics in the context of loading a major sports site for the first time.

Chart comparing Display time, elapsed time, CPU time, resource uitilization, and power consumption

Display Time – Display Time measures the time from when the user performs an action until the user sees the result of that action on the screen.

Elapsed Time – Most sites continue to perform background work after content has been displayed to the screen. Examples might include downloading the next email in a web mail application or sending analytics back to a provider. From the user’s perspective, the site might appear finished; however, significant work is often occurring which can impact overall responsiveness.

CPU Time – Modern web browsers are almost exclusively limited by the speed of the CPU. Offloading work to the GPU and making the CPU more efficient makes a large impact on performance.

Resource Utilization – Building a fast browser means ensuring resources across the entire PC work well together, including network utilization, memory usage patterns, GPU processing, graphics, memory, and hundreds of other dimensions. Since users run several applications at the same time on their PCs, it’s important for browsers to responsibly share these resources with other applications.

Power Consumption – Increasing power efficiency leads to longer the battery life in mobile scenarios, lower electricity costs for the device, and a smaller environmental impact.

Concentrating only on a single metric creates an overly simplistic view of performance. By focusing on a single metric, humans naturally tend to optimize for that metric, often at the expense of other equally important metrics. The only way to combat that tendency is to measure all aspects of performance, and then make the tradeoffs consciously, rather than implicitly.

In total, the Performance Lab measures over 850 different metrics. Each one provides part of the picture of browser performance. To give a feel for what we measure, here’s a (non-exhaustive) list of key metrics: private working set, total working set, HTTP request count, TCP bytes received, number of binaries loaded, number of context switches, DWM video memory usage, percent GPU utilization, number of paints, CPU time in JavaScript garbage collection, CPU time in JavaScript parsing, average DWM update interval, peak total working set, number of heap allocations, size of heap allocations, number of outstanding heap allocations, size of outstanding heap allocations, CPU time in layout subsystem, CPU time in formatting subsystem, CPU time in rendering subsystem, CPU time in HTML parser subsystem, idle CPU time, number of threads.

Windows event tracing infrastructure

Metrics are gathered using Windows Event Tracing Infrastructure (ETW) and VMMap. ETW is the Windows-wide event logging system that is used by many Windows components and third-party applications, including the Windows Event Log. ETW logging APIs are extremely low level and low overhead, which is critical for performance testing.

The view shows 6 graphs stacked vertically. Graphs are named CPU Usage by Process, Generic Events, WinINet End-to-End Downloads, IE CPU Breakdown, WinInet Transfer Setups, and IE Repaint.

The trace viewer included in WPT, xperfview.exe, is a powerful visualizer that allows correlation and overlaying kernel, CPU, GPU, I/O, networking, and other events. WPT also supports stack walking. Stack walking takes a snapshot of the program’s callstack at regular intervals and saves the stack as part of the trace. By correlating ETW events with stacks, WPT will display not only what work was being done, but the callstack associated with that work and the amount of time spent doing that work, with 10 microsecond resolution. Stack walking can be enabled on any process, even one that does not use ETW events. The drawback to stack walking is that it requires debugging symbols to decode the stacks, and is susceptible to aliasing.

Testing a scenario

The final piece of the puzzle is the actual test process. Testing can be broken into 3 phases: setup, testing, and errors and cleanup. Here’s a flowchart of the entire process to follow along.

A complex flow chart, starting with "User requests run" and ending with "Run is marked finished"

Setup

The process starts when a user requests a run through the lab website or automation framework. The run is placed into a priority queue with other pending runs. When a test client becomes available, it checks the queue and starts the highest priority job that it can. First, the test client installs the Test OS specified. The IE Performance Lab supports testing on Vista, Windows 7, and Windows 8. The test client installs a fresh copy of the Test OS for every run so the machine always starts in a known

good state.

Once the Test OS is installed, the client configures WPT, VMMap, and the test harness. The run also specifies a number of IE settings such as the homepage, use of Suggested Sites, InPrivate browsing, and others. Any third-party software is also installed and configured at this point.

The final step before testing is ensuring that the test client is idle to minimize test interference. Windows defines a concept of idle tasks. Idle tasks are a way for Windows and other developers to schedule non-critical work to happen at a later time when the user is not competing for resources. OS idle tasks include prefetching or SuperFetching, disk defragmentation, updating search indexes, and others, depending on OS version and configured services. To ensure that no idle work is done during the tests, the idle task queue is flushed.

Additionally, Windows Defender is paused and the log location for the test harness is marked as excluded from the Windows Indexing Service to prevent log and trace files from causing the indexer to start during a test run. Testing is done in multiple passes to minimize the number of providers needed, since additional providers increase the observer effect. The first pass is always a warm-up pass. Warm-up ensures that the browser binaries are “warm” and that the maximum amount of cachable page content is available in the WinINET cache. Subsequent passes each focus on a specific type of instrumentation, like stack walking, memory tracing, and I/O and registry tracing.

Errors and cleanup

If at any time during the test the browser crashes, the test pass is considered failed and the run moves on to the next test pass. If at any time during the tests Windows crashes, the computer reboots and the OS is reinstalled, since its state cannot be guaranteed. If the number of retries exceeds the threshold, the whole run is considered failed and the machine moves on to another run to prevent endlessly trying to test an unstable build.

When all the test cases are complete, the test client uploads the logs and traces for analysis. The test client then returns to an idle state and begins polling for a new run.

Results investigation

Each metric is tracked change-over-change. We run each test case a minimum of ten times, and duplicate runs on at least two different machines to create the sample population. Using statistical tools, uncharacteristic results can be automatically flagged for investigation. A variance change is also considered a regression. Users interact with IE under a wide range of circumstances and on a wide range of hardware, and one of our goals is to ensure a smooth and predictable experience every time.

In addition to automated analysis, a triage team investigates the daily results to watch for trends and other interesting behaviors. Manual investigation cannot be eliminated because many statistical tools assume both a normal distribution and that all samples are independent.

Neither assumption may be strictly true for our measurements. Some activities in IE are driven by a timer from the OS, meaning results are also dependent on when (along the timer’s cycle) the page load begins. A page load that starts right before or after a timer interrupt may do more or less work because IE must service the interrupt at different points in the page-load process. This interruption can have a rippling affect that leads to a bimodal distribution. Also, because we use repeated trials (and we don’t wipe the machine between iterations) the next trial is influenced by previous trials. Here’s a sample Elapsed Time graph for Bing Maps for change-over-change comparison.

A bar chart with a red line superimposed. A mouse pointer hovers over one point in the chart, and next to this is a tooltip listing max, median, min, and other info.

The red series shows the median value of each test run, and grey bars show the range. Hovering over a test run will show the iterations for the metric (in blue) as well as a tooltip that provides the exact values for minimum, median, max values, as well as the absolute and relative difference with the previous test run. The tooltip shown in this image also provides additional context like the build being tested, and a quick link to our source control system to view the changes in the build.

The combination of automated analysis and manual investigation provides the IE team with reliable and actionable data for performance tuning.

Testing third-party software

Many third-party applications depend on Trident, the network stack, and other IE components. Extensions like BHOs and toolbars load within the IE context. Other applications, like security software, can inject themselves between IE components. These applications become part of the IE stack, and can lead to poor performance. The Performance Lab is capable of measuring the impact of third-party software on browsing real world content in a controlled environment. These studies are important to IE and the ecosystem because users generally cannot quantify the impact of popular software on their browsing experience.

When testing third-party software impact, we compare a run with third-party software installed, with a clean run with only IE installed, to determine the impact of the software. In particular, we are interested in measuring two metrics: startup time and navigation time. Startup time measures the time it takes to launch the browser and navigate to an URL, whereas navigation time measures the time it takes to navigate to an URL when the browser has already been launched. Startup will also include the time that third-party applications take to load their IE extensions.

Using cached content allows repeatability in our measurements. Further, by measuring a cached site, we can definitively know that a performance regression is caused by the third-party software and not by differences in the site. Whenever measuring the impact of third-party software, we also validate our findings by testing startup and navigation on a direct connection to the Internet, to verify that the testing environment is not responsible for any deltas.

Many third-party applications offload work during a page navigation to cloud services. While parallelization of work and use of cloud services are excellent techniques to improve performance, some applications wait synchronously for the results from the network, blocking the navigation in the process. There are many real world scenarios, like strict firewalls, WAN connections, and offline scenarios, where such patterns can lead to poor performance for users. Third-party software should never process synchronously in response to an IE or user action, and should batch UI and DOM updates to minimize disruption.

Building a fast browser for users

Real world browser performance matters. Measuring performance at scale is a significant investment and a full-time job, but the results are well worth the effort. The data gathered by the Internet Explorer Performance Lab is instrumental in our understanding of browser performance and of the underlying PC hardware, and in developing a fast, fluid, and responsive web experience for users.

—Matt Kotsenas, Jatinder Mann, and Jason Weber for the Internet Explorer Performance Team

IEBlog: IE9 Includes Hardware Accelerated Canvas

In this IEBlog post, Paul and I announce Internet Explorer 9 support for HTML5 Canvas:

1 Jul 2010 6:24 PM

With the recent release of the latest IE9 platform preview, we talked about how we’re rebuilding the browser to use the power of your whole PC to browse the web, and to unlock a new class of HTML5 applications. One area that developers are especially excited about is the potential of HTML5 canvas. Like all of the graphics in IE9, canvas is hardware accelerated through Windows and the GPU. In this blog post we discuss some of the details behind canvas and the kinds of things developers can build.

Canvas enables everything from basic shapes to fully interactive graphics

Canvas is a way to program graphics on the web. The <canvas> tag is an immediate mode 2d drawing surface that web developers can use to deliver things like real time graphs, animations or interactive games without requiring any extra downloads.

At the most basic level, canvas enables you to draw primitives like lines, rectangles, arcs, Bezier curves, quadratic curves, images and video like the following:

This image is a simulation of what you’d see in a canvas enabled browser.

Please use the IE9 preview to see these examples running in canvas.

The Canvas Pad demo on the IE test drive site goes into detail on the canvas syntax and enables you to easily experiment with a wide range of examples. Feel free to make changes to any of the samples that are there to see how it works — for example, try changing colors or sizes of things.

Taking things a step further, you can use JavaScript to animate canvas drawings or make interactive experiences. The next example draws lines as you move your mouse (or as you move your finger on touch enabled devices) over the black box. You could also choose to have your canvas experience react to keyboard input, mouse clicks or any browser event.

This image is a simulation of what you’d see in a canvas enabled browser.

With canvas support in IE9, you can move your mouse over the black box and draw lines.

By utilizing the full power of the PC with hardware acceleration for graphics and fast JavaScript for animation, web developers can use IE9 to build deep, graphically rich experiences. Since canvas is an element like other elements in HTML, it participates in the page layout and its API is exposed to JavaScript so it can be fully incorporated into a web page’s design. This makes it possible for sites to include things like live data visualizations, games, splash pages and ads without the need for any extra downloads or plugins.

The IE testdrive site includes several examples that demonstrate the kinds of things that sites are now able to do in an interoperable way.

Shopping

The Amazon Shelf shows what shopping for books could look like when the web site designer is able to use the kind of graphics, animations and smooth transitions that canvas enables.

Immersive game experiences:

The following demos showcase some gaming concepts like physics, character animation, collision detection and mouse interaction coupled with hardware accelerated graphics. In these demos, you’ll notice that not all browsers can update the screen with the same frequency (FPS or frames per second). IE is able to maintain a high FPS by using Windows technologies to make use of your GPU – your computer’s hardware that’s optimized for rendering graphics.

FishIE Tank

This demo makes use of sprites to animate the fish and basic collision logic to redirect the fish when they hit the edges of the tank. It’s also good for measuring graphics performance because you can change the number of fish to increase or decrease the graphics load.

Asteroid Belt

The asteroid in the demo follows your mouse, scales and rotates. It’s an example of direct interactivity that you might find in a game.

Mr. Potato Gun

A physics engine in this demo defines how the different parts of Mr. Potato head are launched from the gun and then how they react when they bounce off the ground. Many games use some form of physics engine like this to manage particle movement and their response.

Canvas Zoom

This demo enables you to start with a very wide angle on an image like this mountain range and then zoom in very close image like people at a picnic. For games, it’s an interesting example of scaling and smooth transitions.

Demos from around the web:

There are some pretty amazing demos floating around the web and I’d like to share a couple of our favorites — there are many more. An important part of implementing canvas is that we do it in an interoperable way so that developers can use the same markup. To help achieve this goal, we’re always looking for examples that work and those that don’t. A future canvas blog post will go into detail about how we work to be interoperable and what we do when there’s an issue reported.

I hope you enjoy some of these canvas examples from people around the web.

Cloth Simulation

This demo is interactive and the cloth is responsive to movement and gravity.

Zwibbler

The shapes in this drawing app are preserved so you can select and then move, resize, or change their styling.

Liquid Particles

The particles in this demo are drawn to or repelled from the mouse.

Kaleidoscope

This one does a nice job of drawing you in – it’s engaging and interesting to watch the patterns as they evolve.

Nebula Visualization

The alpha blending used by this demo are really well done. The result is a cloudy atmospheric look. It’s graphics intensive and it’s still very fast and smooth in IE9.

Animated Reflection

The author of this demo says, “The script is currently using 80% of my cpu so it’s not really practical. Hopefully we will be getting JIT’d javascript sometime soon.” Well, now JavaScript is compiled in IE9. It generally uses about 1% of my CPU.

Asteroids in Canvas

This is a full game with nice graphics, collision detection, keyboard interactivity, score keeping and… green lasers.

Particle Animation

See your name in lights. This is another demo that includes a particle system. You can run this with 300 or 1500 sprites. Go ahead and bump it up to 1500.

We’re looking forward to seeing the kinds visual experiences web developers will be able to build with a fully hardware accelerated browser.

Give it a try yourself. Watch the videos, get the latest platfrom preview, try out the canvas demos and build some examples of your own. If you find a bug in how canvas works or where the same markup behaves differently, please report bugs on Connect.

– Thanks, Paul Cutsinger and Jatinder Mann