Understanding the Real-World Performance of your Web Application Across IE11 and Other Browsers


In this IE Blog article I talk about how to use the Timing APIs to understand the real-world performance of your web applications.

Together with Google, Mozilla, Microsoft, and other community leaders, the W3C Web Performance working group has standardized the Navigation Timing, Resource Timing, User Timing, and Performance Timeline interfaces to help you understand the real-world performance of navigating, fetching resources, and running scripts in your Web application. You can use these interfaces to capture and analyze how your real-world customers are experiencing your Web application, instead of relying on synthetic testing, which tests the performance of your application in an artificial environment. With this timing data, you can identify opportunities to improve the real-world performance of your Web applications. All of these interfaces are supported in IE11. Check out the Performance Timing Test Drive to see these interfaces in action.

The Performance Timing testdrive lets you try out the Timing APIs.
The Performance Timing Test Drive lets you try out the Timing APIs.

Performance Timeline

The Performance Timeline specification has been published as a W3C Recommendation and is fully supported in IE11 and Chrome 30. Using this interface, you can get an end to end view of time spent during navigating, fetching resources, and executing scripts running in your application. This specification defines both the minimum attributes all performance metrics need to implement and the interfaces developers can use to retrieve any type of performance metric.

All performance metrics must support the following four attributes:

  • name. This attribute stores a unique identifier for the performance metric. For example, for a resource, it will be the resolved URL of the resource.
  • entryType. This attribute stores the type of performance metric. For example, a metric for a resource would be stored as “resource.”
  • startTime. This attribute stores the first recorded timestamp of the performance metric.
  • duration. This attribute stores the end-to-end duration of the event being recorded by the metric.

All of the timing data is recorded in high resolution time using the type DOMHighResTimeStamps, defined in the High Resolution Time specification. Unlike DOMTimeStamps which measure time values in milliseconds from 01 January, 1970 UTC, the high resolution time value is measured in at least microsecond resolution from the start of navigation of the document. For example, if I check the current time using performance.now(), the high resolution time analogous for Date.now(), I would get the following interpretation of the current time:

> performance.now();

4038.2319370044793


> Date.now()

1386797626201

This time value also has the benefit of not being impacted by clock skew or adjustments. You can explore the What Time Is It Test Drive to understand the use of high resolution time.

You can use the following interfaces to retrieve a list of the performance metrics recorded at the time of the call. Using the startTime and duration, as well as any other attributes provided by the metric, you can obtain an end-to-end timeline view of your page performance as your customers had experienced.

PerformanceEntryList getEntries();

PerformanceEntryList getEntriesByType(DOMString entryType);

PerformanceEntryList getEntriesByName(DOMString name, optional DOMString entryType);

The getEntries method returns a list of all of the performance metrics on the page, whereas the other methods return specific items based on the name or type. We expect most developers will just use JSON stringify on the entire list of metrics and send the results to their server for analysis rather than processing the information on the client.

Let’s take a closer look at each of the different performance metrics: navigation, resource, marks, and measures.

Navigation Timing

The Navigation Timing interfaces provide accurate timing measurements for each of the phases of navigating to your Web application. The Navigation Timing L1 specification has been published as a W3C Recommendation, with full support since IE9, Chrome 28, and Firefox 23. The Navigation Timing L2 specification is a First Public Working Draft and is supported by IE11.

With Navigation Timing, developers can not only get the accurate end-to-end page load time, including the time it takes to get the page from the server, but also get the breakdown of where that time was spent in each of the networking and DOM processing phases: unload, redirect, app cache, DNS, TCP, request, response, DOM processing, and the load event. The script below uses Navigation Timing L2 to get this detailed information. The entry type for this metric is “navigation,” while the name is “document.” Check out a demo of Navigation Timing on the IE Test Drive site.

<!DOCTYPE html>

<html>

<head></head>

<body>

<script>

 functionsendNavigationTiming() {

   var nt = performance.getEntriesByType(‘navigation’)[0];

   var navigation = ‘Start Time: ‘ + nt.startTime;

   navigation += ‘Duration: ‘ + nt.duration;

   navigation += ‘Unload: ‘ + (nt.unloadEventEnd – nt.unloadEventStart);

   navigation += ‘Redirect: ‘ + (nt.redirectEnd – nt.redirectStart);

   navigation += ‘App Cache: ‘ + (nt. domainLookupStart – nt.fetchStart);

   navigation += ‘DNS: ‘ + (nt.domainLookupEnd – nt.domainLookupStart);

   navigation += ‘TCP: ‘ + (nt.connectEnd – nt.connectStart);

   navigation += ‘Request: ‘ + (nt.responseStart – nt.requestStart);

   navigation += ‘Response: ‘ + (nt.responseEnd – nt.responseStart);

   navigation += ‘Processing: ‘ + (nt.domComplete – nt.domLoading);

   navigation += ‘Load Event: ‘ + (nt.loadEventEnd – nt.loadEventStart);

   sendAnalytics(navigation);

 }

</script>

</body>

</html>

By looking at the detailed time spent in each of the network phases, you can better diagnose and fix your performance issues. For example, you may consider not using a redirection if you find redirect time is high, use a DNS caching service if DNS time is high, use a CDN closer to your users if request time is high, or GZip your content if response time is high. Check out this video for tips and tricks on improving your network performance.

The main difference between the two Navigation Timing specification versions is in how timing data is accessed and in how time is measured. The L1 interface defines these attributes under the performance.timing object and in milliseconds since 01 January, 1970. The L2 interface allows the same attributes to be retrieved using the Performance Timeline methods, enables them to be more easily placed in a timeline view, and records them with high resolution timers.

Prior to Navigation Timing, developers would commonly try to measure the page load performance by writing JavaScript in the head of the document, like the below code sample. Check out a demo of this technique on the IE Test Drive site.

<!DOCTYPE html>

<html>

<head>

<script>

 var start = Date.now();


 function sendPageLoad() {

   var now = Date.now();

   var latency = now – start;

   sendAnalytics(‘Page Load Time: ‘ + latency);

 }


</script>

</head>

<body onload=’sendPageLoad()’>

</body>

</html>

However, this technique does not accurately measure page load performance, because it does not include the time it takes to get the page from the server. Additionally, running JavaScript in the head of the document is generally a poor performance pattern.

Resource Timing

Resource Timing provides accurate timing information on fetching resources in the page. Similar to Navigation Timing, Resource Timing provides detailed timing information on the redirect, DNS, TCP, request, and response phases of the fetched resources. The Resource Timing specification has been published as a W3C Candidate Recommendation with support since IE10 and Chrome 30.

The following sample code uses the getEntriesByType method to obtain all resources initiated by the element. The entry type for resources is “resource,” and the name will be the resolved URL of the resource. Check out a demo of Resource Timing on the IE Test Drive site.

<!DOCTYPE html>

<html>

<head></head>

<body onload=’sendResourceTiming()’>

<img src=’http://some-server/image1.png’&gt;

<img src=’http://some-server/image2.png’&gt;

<script>

 function sendResourceTiming()

 {

  var resourceList = window.performance.getEntriesByType(‘resource’);

  for (i = 0; i < resourceList.length; i++)

  {

   if(resourceList[i].initiatorType == ‘img’)

   {

    sendAnalytics(‘Image Fetch Time: ‘ + resourceList[i].duration);

   }

  }

 }

</script>

</body>

</html>

For security purposes, cross-origin resources only show their start time and duration; the detailed timing attributes are set to zero. This helps avoid issues of statistical fingerprinting, where someone can try to determine your membership in an organization by confirming whether a resource is in your cache by looking at the detailed network time. The cross origin server can send the timing-allow-origin HTTP header if it wants to share timing data with you.

User Timing

User Timing provides detailed timing information on the execution of scripts in your application, complementing Navigation Timing and Resource Timing which provide detailed network timing information. User Timing allows you to display your script timing information in the same timeline view as your network timing data to get an end to end understanding of your app performance. The User Timing specification has been published as a W3C Recommendation, with support since IE10 and Chrome 30.

The User Timing interface defines two metrics used to measure script timing: marks and measures. A mark represents a high resolution time stamp at a given point in time during your script execution. A measure represents the difference between two marks.

The following methods can be used to create marks and measures:

void mark(DOMString markName);

void measure(DOMString measureName, optional DOMString startMark, optional DOMString endMark);

Once you have added marks and measures to your script, you can retrieve the timing data by using the getEntry, getEntryByType, or getEntryByName methods. The mark entry type is “mark,” and the measure entry type is “measure.”

The following sample code uses the mark and measure methods to measure the amount of time it takes to execute the doTask1() and doTask2() methods. Check out a demo of User Timing on the IE Test Drive site.

<!DOCTYPE html>

<html>

<head></head>

<body onload=’doWork()’>

<script>

 function doWork()

 {

  performance.mark(‘markStartTask1′);

  doTask1();

  performance.mark(‘markEndTask1′);

  performance.mark(‘markStartTask2′);

  doTask2();

  performance.mark(‘markEndTask2′);


  performance.measure(‘measureTask1′, ‘markStartTask1′, ‘markEndTask1′);

  performance.measure(‘measureTask2′, ‘markStartTask2′, ‘markEndTask2′);

  sendUserTiming(performance.getEntries());

 }

</script>

</body>

</html>

We want to thank everyone in the W3C Web Performance Working Group for helping design these interfaces and browsers vendors for working on implementing this interface with an eye towards interoperability. With these interfaces, Web developers can truly start to measure and understand what they can do to improve the performance of their applications.

Try out the performance measurement interfaces with your Web apps in IE11, and as always, we look forward to your feedback via Connect.

Thanks,

Jatinder Mann, Internet Explorer Program Manager
Advertisement

Web Performance APIs Rapidly Become W3C Recommendations

In this IE Blog post article, I discuss how the W3C Web Performance APIS are rapidly becoming W3C Recommendations with interoperable support for all major web browsers.

The W3C Web Performance Working Group recently published three specifications as W3C Recommendations with full implementations from all major browser vendors, advancing developers’ ability to accurately measure the performance of Web applications and make the Web faster. Over the last three years, companies including Microsoft, Google, Mozilla, Intel, Facebook, and others have been working towards standardizing the Navigation Timing, High Resolution Time, and Page Visibility interfaces in the Working Group. Rapid adoption of these recommendations demonstrates what’s possible when the industry and community come together through the W3C.

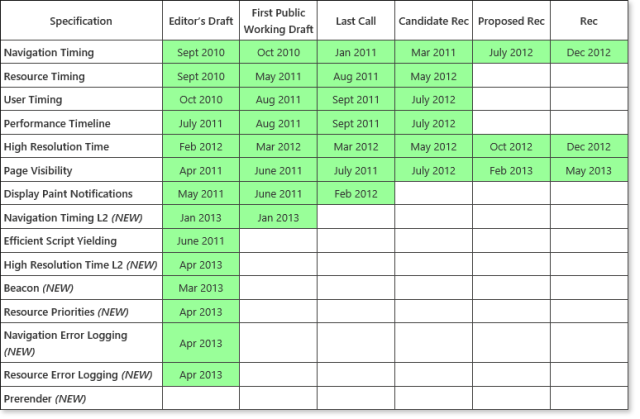
To make the Web faster, developers need the ability to accurately measure the performance characteristics of Web applications and the ability to effectively use the underlying hardware to improve the performance of their applications. To solve these problems, the Web Performance Working Group worked on 15 different specifications that address those issues. The table below shows the maturity level of all the specifications currently edited by the Working Group.

Web Performance Spec Status 5_22_2013

The Navigation Timing, Resource Timing, User Timing, and Performance Timeline specifications help developers accurately measure the timing of the navigation of the document, fetching of resources on the page, and developer script execution. Prior to these APIs, this data wasn’t easily obtainable. Navigation Timing was published as a W3C Recommendation, and all major browser vendors support it. The other three interfaces are currently at the Candidate Recommendation stage awaiting two full implementations from browser vendors. IE10 is currently the only browser that implements all of these interfaces, however, other vendors are working on implementations.

To ensure these performance metrics are measured in the most accurate way possible, the High Resolution Time specification allows developers to measure operations with sub-millisecond accuracy. This interface not only benefits accurate measurements of performance metrics, but also allows better frame rate calculations and synchronization of animations or audio cues. This interface has been published as a W3C Recommendation, with all major browser vendors implementing the performance.now() method defined in the specification.

The Page Visibility API allows for programmatically determining the current visibility state of the page. Developers can use this data to make better CPU- and power-efficiency decisions, e.g., throttling down activity when the page is in the background tab. This specification has also been published as a W3C Recommendation, with all major browser vendors implementing it.

The Timing Control for Script-Based Animations, and Efficient Script Yielding specifications help developers write more CPU- and power-efficient Web applications. The requestAnimationFrame API, from the Timing Control for Script-Based Animations specification, allows for creating more efficient JavaScript animations. All browser vendors fully support this interface, with the Working Group actively working on publishing this specification as a Candidate Recommendation. The setImmediate API, from the Efficient Script Yielding specification, allows developers to efficiently yield control flow to the user agent and receive an immediate callback, efficiently leveraging the CPU. IE10 is the first browser to implement this interface.

This year the Working Group also started to look at new ideas, with editor’s drafts of those ideas currently being discussed in the Working Group. The Beacon API is intended to help scripts asynchronously transfer data to a Web server without blocking the unload event, which can negatively impact the perceived performance of the next navigation. The Resource Priorities API defines a means for Web developers to give the browser hints on the download priority of resources to help improve the page load time. As a corollary to the Timing specs, the Navigation Error Logging and Resource Error Loggingspecifications help developers understand the errors and availability of their applications. The Navigation Timing Level L2 specification adds High Resolution Time and Performance Timeline support to Navigation Timing, and High Resolution Time L2 specification adds Web Worker support. These are just some of the drafts the Working Group is currently defining, with more specification drafts on Prerender and other diagnostics areas forthcoming.

The W3C Web Performance Working Group is a great example of how quickly new ideas can become interoperable standards that developers can depend on in modern HTML5-enabled browsers. Together with industry and community leaders who participate in the Working Group, we hope to continue to make rapid progress on interoperable standards that will help developers make the Web faster.

Thanks,
Jatinder Mann
Internet Explorer Program Manager

W3C Web Performance: Continuing Performance Investments

I discuss the W3C Workshop on Performance in this IE Blog post article.

The W3C Web Performance working group recently held the W3C Workshop on Performance on Thursday, November 8, 2012. The goal was to hear current challenges and proposals for new performance ideas for the working group to consider. There were 45 attendees from 21 organizations, including most browser manufactures (Microsoft, Google, and Mozilla), hardware organizations (Intel, Qualcomm, Nokia, Motorola), network organizations (Cisco, Akamai, F5), and top Web properties (GMail, Google Search, Bing, NetFlix, LinkedIn, Zynga, and more). Details on the presentations and discussions from the workshop can be found in this report.

Providing the ability to accurately measure the performance characteristics of Web applications and create power- and CPU-efficient applications is critical to Web performance. The W3C Web Performance working group worked on achieving those goals in its recently completed second chartered period. In under two years, the working group rapidly standardized and modern HTML5-enabled Web browsers implemented these eight interfaces: Navigation Timing, Resource Timing, User Timing, Performance Timeline, Page Visibility, Timing control for script-based animations, High Resolution Timeand Efficient Script Yielding. Internet Explorer 10 is the first browser to support all eight of these new APIs.

The working group has since been focused on gathering data to understand which areas to focus on in its third chartered period. In addition to the Workshop on Performance, the working group has invited performance experts to its weekly conference calls and has broadly surveyed the performance community on ideas.

Based on all the data gathered these past few months, the Web Performance working group has decided to focus on the following areas in the third chartered period:

  • Timing Metrics The working group will continue to improve the Timing interfaces, Navigation Timing, Resource Timing, User Timing and Performance Timeline. For example, we will consider providing Web workers support in the Timing interfaces and including information on video byte ranges in Resource Timing.
  • Efficient Script Yielding The working group will continue to improve on power- and CPU-efficient APIs, like the setImmediate API defined in the Efficient Script Yielding specification.
  • Prerender The working group will standardized the prerender feature which allows navigations to appear almost “instantly” in cases where the browser has high confidence that a user will visit an URL. The way this feature would work is that the browser will proactively navigate to a Web page in a hidden tab, when it sees the “prerender” link type or has high confidence that user will visit that link. When the user does visit that link, the browser will make the hidden tab visible, giving the perception of instant navigation.
  • Resource Priorities Today, browsers download resources in the priority order that they believe are most efficient in helping the page load occur quickly. However, developers may want to prioritize some resources over others. For example, downloading images above the fold may be of higher priority than those below the fold. Though, developers can give some hints to the browser on download priority, like using the “defer” and “async” attributes in markup, these concepts do not include most resources. To help the browser prioritize downloading resources, the working group is expanding the charter to include interoperable means for developers to give the browser hints on the download priority of resources.
  • Diagnostics Interfaces Developers are interested in learning how to make their Web applications faster and less error prone. The working group is expanding the charter to include interoperable means for developers to get browser diagnostics information on their Web applications. For example, using these interfaces a developer could understand where memory is leaking or what errors users are encountering on their Web applications.
  • Beacon Today, analytics scripts will block the current page from unloading by running in a loop in order to confirm that analytics data has been sent to a Web server. This behavior will delay the navigation to the next page, resulting in user perception of poor performance. To help developers avoid that pattern, the working group is expanding the charter to include an interoperable means for developers to asynchronously transfer data from the browser to a Web server, with a guarantee from the browser that the data will eventually be sent.
  • Display Performance Developers are interested in understanding the performance of their games and animations.

    The working group is expanding the charter to include interoperable means for developers to get frame rate and throughput of the display type of information.

This working group is a great example of how quickly new ideas can become interoperable standards that developers can depend on in modern HTML5-enabled browsers. Together with industry and community leaders who participate in the working group, we hope to continue to make rapid progress on interoperable standards that will benefit developers and everyone who uses the Web.

Jatinder Mann, Internet Explorer, Program Manager

Web Performance: When millisecond resolution just isn’t enough

I discuss when milliseconds just aren’t enough in this IE Blog article:

Sometimes measuring time in millisecond resolution just isn’t accurate enough. Together with industry and community leaders, the W3C Web Performance working group has worked to solve this problem by standardizing the High Resolution Time specification. As of this week, this specification has been published as a Proposed Recommendation (PR) and is widely adopted in modern browsers. Take a look at the What Time is it? test drive demo to see how this API works.

This specification has gone from just an idea to PR in eight short months. The PR stage of standardization is the final step before a Web standard becomes an official W3C Recommendation. Additionally, this interface has been broadly adopted in browsers, including full support in Internet Explorer 10 and Firefox 15, and supported with a prefix in Chrome 22. This is a great example of what’s possible when the industry and community come together through the W3C.

So why aren’t milliseconds good enough? Time has long been measured in the Web platform using some form of the JavaScript Date object, whether it is through the Date.now() method or the DOMTimeStamp type. The Date object represents a time value as time in milliseconds since 01 January, 1970 UTC. For most practical purposes, this definition of time has been sufficient to represent any instant to within 285,616 years from 01 January, 1970 UTC.

For example, at the time of writing this blog, my Date.now() time value from my IE10 Developer Tools Console was 1350509874902. This thirteen digit number represents the number of milliseconds from the origin of this time base, 01 January, 1970. That time corresponds to 17 Oct 2012 21:37:54 UTC.

Though this definition will continue to be genuinely useful for determining the current calendar time, there are some cases where this definition is not sufficient. For example, it is useful for developers to determine if their animation is running smoothly at 60 frames per second (one frame painted every 16.667 milliseconds). Using the simple method of calculating the instantaneous FPS by measuring when the frame drawing callback was last made, one can only determine FPS to 58.8 FPS (1/17) or 62.5 FPS (1/16).

Similarly, sub-millisecond resolution is also desirable when accurately measuring elapsed time (e.g., using the Navigation Timing, Resource Timing and User Timing APIs to instrument your network and script timing) or when attempting to synchronize animation scenes or audio with animation.

To solve this issue, the High Resolution Time specification defines a new time base with at least microsecond resolution (one thousandth of a millisecond). To reduce the number of bits used to represent this number and to increase readability, instead of measuring time from 01 January, 1970 UTC, this new time base measures time from the beginning of navigation of the document, performance.timing.navigationStart.

The specification defines performance.now() as the analogous method to Date.now() for determining the current time in high resolution. The DOMHighResTimeStamp is the analogous type to DOMTimeStamp that defines the high resolution time value.

For example, looking at the current time using performance.now() and Date.now() in the IE10 Developer Tools Console at the time of writing this blog, I see the following two values:

performance.now():           196.304879519774
Date.now():        1350509874902

Even though both of these time values represent the same instance in time, they are being measured from a different origin. The performance.now() time value definitely feels more readable.

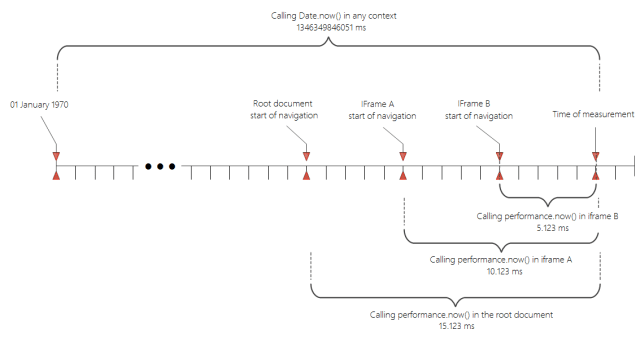
As High Resolution Time is measured from the start of a document’s navigation, performance.now() in a sub-document will be measured from the start of navigation of the sub-document, not the root document. For example, suppose a document has same-origin iframe A and cross-origin iframe B, where a navigation occurred in iframe A about 5 milliseconds after the start of navigation of the root document and in iframe B about 10 milliseconds after the start of navigation of the root document. If we measure the exact moment of time 15 milliseconds after the start of navigation of the root document, we would get the following values for performance.now() calls in the different contexts:

performance.now() in iframe B:                                5.123 ms

performance.now() in iframe A:                               10.123 ms

performance.now() in root document:                    15.123 ms

Date.now() in any context:                         134639846051 ms

Figure: Date.now() is time measured since 01 January 1970, whereas performance.now() is time measured since the start of the document navigation

This design not only ensures there is no data leakage on the time of creation of the parent in cross-origin iframes, it also allows you to measure time relative to your start. For example, if you were using the Resource Timing interface (which uses High Resolution Time) to determine how long it takes for a server to respond to a resource request in a sub-document, you wouldn’t need to make adjustments to take the time of adding the sub-document to the root document into account.

If you wish to do cross frame time comparisons, you would just need to request top.performance.now() to get a time value relative to the root document’s start of navigation, which would return the same value in all same-origin iframes.

Another significant benefit of this API over Date.now() is that performance.now() is monotonically increasing and not subject to clock skew or adjustment. The difference between subsequent calls to performance.now() will never be negative. Date.now() doesn’t have such a guarantee and in practice we have heard of reported cases where negatives time have been seen in analytics data.

High Resolution Time is another great example of how quickly new ideas can become interoperable standards that developers can depend on in modern HTML5-enabled browsers. Thanks to everyone in the W3C Web Performance Working Group for helping design this API and to other browser vendors for rapidly implementing it with an eye towards interoperability.

Thanks,
Jatinder Mann
Internet Explorer Program Manager

W3C Web Performance Workshop

In this IE Blog article, I discuss the W3C Web Performance Workshop:

The W3C Web Performance Working Group is looking for new use cases and performance issues to solve in its next chartered period. To that effect, the Working Group is holding a public workshop on November 8, 2012, in Mountain View, CA where performance experts and Web developers are invited to present ideas and discuss current challenges. Statements of interest will be the basis of the discussion at the Workshop and must be submitted by October 29th to this mailing list.

Fast HTML5 Web applications benefit consumers who browse the Web and developers building innovative new experiences. Just over two years ago, the W3C announced the formation of the Web Performance Working Group chartered with two goals: making it easier to measure and understand the performance characteristics of Web applications and defining interoperable methods to write more CPU- and power-efficient applications.

Over the course of these two years, together with Google, Mozilla, Facebook, and other industry and community leaders who participate in the W3C Web Performance Working Group, the working group has designed and standardized eight interfaces that are now widely adopted in modern HTML5-enabled browsers: Navigation Timing, Resource Timing, User Timing, Performance Timeline, Page Visibility, Timing control for script-based animations, High Resolution Time and Efficient Script Yielding. These APIs are supported in Internet Explorer, Firefox, and Chrome, and are great examples of how quickly new ideas can become interoperable standards that developers can depend.

If you are interested in sharing feedback to the Working Group and cannot attend the workshop, you can do so by completing this survey. The deadline for the survey is November 2nd.

Thanks, — Jatinder Mann, Program Manager, Internet Explorer

IEBlog: Web Performance APIs Rapidly Become W3C Candidate Recommendations

In this IE Blog article, I discuss how the Web Performance APIs are rapidly standaridizing.

We’re pleased to share that three new W3C Web Performance Working Group specifications moved to W3C Candidate Recommendations. Accurately measuring the performance characteristics of Web applications is critical to making the Web faster. In addition, developers need the ability to effectively use the underlying hardware to improve the performance of their applications. Over the last two years, companies including Microsoft, Google, Mozilla, Intel, and Facebook have been working toward these goals through the working group. This is a great example of what’s possible when the industry and community come together through the W3C.

The Navigation Timing, Resource Timing, User Timing and Performance Timeline specifications help developers accurately measure Web application performance. The first three specifications provide developers with information related to the navigation of the document, resources on the page, and developer scripts, respectively. The Performance Timeline specification defines a unifying interface to retrieve this timing data. Prior to these API’s it was not possible for developers to accurately measure their site performance.

To ensure these performance metrics are measured in the most accurate way possibly, the High Resolution Time specification defines a sub-millisecond clock resolution. This interface not only benefits accurate measurements of performance metrics, but also allows better frame rate calculations and synchronization of animations or audio cues. For the first time developers can measure operations with sub-millisecond accuracy.

The Page Visibility, Timing control for script-based animations, and Efficient Script Yielding specifications help developers write more CPU- and power-efficient Web applications. The Page Visibility API allows for programmatically determining the current visibility state of the page. Developers can use this data to make better CPU- and power-efficiency decisions, e.g., throttling down activity when the page is in the background tab. The requestAnimationFrame API, from the Timing control for script-based animations specification, allows for creating more efficient JavaScript animations. Finally, the setImmediate API, from the Efficient Script Yielding specification, allows developers to efficiently yield control flow to the user agent and receive an immediate callback, efficiently leveraging the CPU.

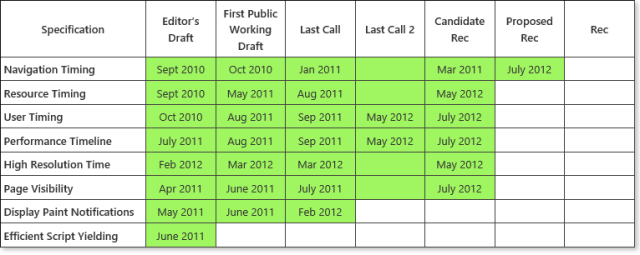
In order to ensure Web developers only have to write code once and have it work interoperably in all browsers, the Working Group has worked diligently these last two years to standardize these APIs. The table below shows the maturity level of all the specifications currently being edited in the Working Group.

Web Performance Spec Status 7_27_2012

Table showing the status of W3C Web Performance Specifications

As of this month, the Navigation Timing specification has been published as a Proposed Recommendation (PR). This stage of standardization is the final step before a Web standard becomes an official W3C Recommendation. Additionally, this interface has been broadly adopted in browsers, including support since Internet Explorer 9, Chrome 6 and Firefox 7. The working group recently started incorporating feedback and working on Navigation Timing 2, the next version of the specification.

As of this month, User Timing, Performance Timeline and Page Visibility specifications have been published as a Candidate Recommendation (CR). This stage of standardization is prior to the PR stage and reflects that the W3C believes this specification has been widely reviewed and satisfies the Working Group’s technical requirements. Resource Timing was published as CR just two months ago, along with High Resolution Time, which went from an Editor’s Draft to CR in just three months.

These APIs are a great example of how quickly new ideas can become interoperable standards that developers can depend on in modern HTML5-enabled browsers. Thanks to everyone in the W3C Web Performance Working Group for helping design these APIs and to other browser vendors for starting to implement these APIs with an eye towards interoperability.

—Jatinder Mann, Program Manager, IE Performance