From minifying your JavaScript to using image sprites, here are 25 top tips for high performance web apps. My article on 25 HTML5 speed tips originally appeared in .Net Magazine Issue 244.
For the past few years I've been part of the IE team at Microsoft looking into ways to improve the online experience. Along the way we've learned a lot about web performance and developed an in-depth understanding of what goes into making sites and apps fast.
Creating high-performance web applications is essential for every web developer, whether we're talking about websites that run on a standards-based web browser or apps for the Windows Store. The goal of the developer is to improve web performance by reducing the following factors:
Display time
The most important objective is what we refer to as 'Display Time'. This has many names across the industry including 'time to glass' and 'primary paint'. Display Time measures the time from when the user performs an action until the user sees the result of that action on the screen. This is the duration from when the user navigates to the site until when the site is visually complete loading.
Elapsed time
Most sites continue to perform work in response to the user action after the content has been displayed to the screen. This may include downloading user data (such as email messaging) or sending analytics back to a provider. From users' perspective, the site may appear loaded. However, significant work is often occurring in the background, which impacts responsiveness.
CPU time
Web browsers are almost exclusively limited by the CPU; the work a browser performs on the CPU and how efficiently that work occurs will make the single largest impact on performance. That's why offloading work to the GPU has made such a significant impact to IE9 and IE10 performance. The amount of CPU time required to perform the action and the CPU efficiency are critical.
Resource utilization
Building a fast browser means ensuring resources across the entire PC work well together. This includes network utilization, memory usage patterns, GPU processing, graphics, memory and hundreds of other dimensions. Since customers run several applications at the same time on their PC, it's important for browsers to responsibly share these resources with other applications.
Power consumption
When utilizing underlying PC hardware, it's important to take power consumption into consideration. The more efficiently a browser uses power, the longer batteries will last in mobile scenarios, the lower the electricity costs for operating the device, and the smaller the environmental impact. Power and performance are complementary goals.
I want to share with you some of the things that I've learned about developing faster websites and apps, and the changes you can make today to improve performance.
There are seven key principles that developers can take into consideration:
- Respond quickly to network requests
- Minimize bytes to download
- Efficiently structure markup
- Optimize media usage
- Write fast JavaScript
- Render in standards mode
- Monitor what your app is doing
Within these seven principles I've included a number of helpful performance tips below that will make your HTML5 websites and apps run faster (watch a video of a presentation I made for even more HTML5 tips).
Respond quickly to network requests
01. Prevent 3xx redirections
When a user clicks on a link, they expect to receive content as quickly as possible. 3xx redirections can create a 250 millisecond delay in an application. This may seem like a short delay, but it's roughly 10 per cent of page load time. Around 63 per cent of the world's top websites contain 3xx redirections.
02. Use content distribution networks (CDNs)

With CDNs you can easily geographically locate your data closer to your user. Services such as Azure help with this and can help to reduce the amount of time that content spends travelling between locations. On today's networks, that can save up to as much as 300 milliseconds.
03. Maximize concurrent connections
When people think about a network, they often think of a single pipeline conducting content back and forth. In fact, the browser can make six concurrent connections at a given time, enabling it to download six resources at once. This is possible across multiple domains: by distributing your content you can further increase the number of resources you can download simultaneously. If your website holds images across six or seven domains, you can significantly reduce the amount of time the page takes to load.
04. Understand your network timing
Understand the breakdown of your network timing – navigation timing, resource timing and user timing – and use standards-based APIs available in modern browsers such as IE10, and in Windows Store apps. You can get higher resolution timing information on the navigation of your document. Navigation timing allows you to understand the amount of time your application spends in various phases.

Minimize bytes downloaded
05. Download fewer resources and bytes
The fewer resources you can download the better. Look at the resources you are downloading and work out where you can cut down. The average website today downloads 777kB of data. The vast majority of these bytes are taken up by images, followed by JavaScript and Flash content.
06. Gzip: compress network traffic
The best way to download fewer bytes is to Gzip your content. Most people will get this service for free because of the servers they are using, but many unintentionally turn off this decoding technique.
07. Standard file capitalization
This often catches people by surprise, but the server will pick up on variations in upper/ lower case. The following download requests are two variations of the same request:
Lower case
-
<img src="icon.png"/>
Title case
-
<img src="Icon.png"/>
From the web platform perspective, these are two different files. Therefore, two different network requests will be processed as a result.
Efficiently structure markup
08. Avoid quirks mode
Always use a standards-based doctype to avoid quirks mode. Start with <!DOCTYPE html>. The modern web has no place for quirks mode, which was designed so that mid-90s web pages would be usable in turn-of-the-century 'modern' browsers like IE6 and Firefox 2.
Most web pages today end up in quirks mode accidentally, as a consequence of an invalid doctype or extraneous text before the doctype. This can cause strange layout issues that are hard to debug.
09. Avoid inline JavaScript events
Take care that you don't use inline JavaScript events inside your HTML markup. One example of this would be <button onclick="validate()">Validate</button>. This is a practice that breaks the clean separation that should exist between the markup, presentation and the behaviour.
Also, if your scripts are loading at the bottom of the file, it's possible for a user to interact with the page, trigger an event and attempt to call a script that hasn't loaded yet, which will cause an error.
10. Link style sheets at the top of the page
By placing the CSS at the top of the page, the browser will issue that request first and simultaneously block painting until CSS is complete. By placing CSS in the head, images, JavaScript and other time intensive resources can be downloaded later. To that end, we would also advise against linking your CSS at the bottom of the page.
11. Only include the necessary styles
It may seem like a good idea to hold one very large CSS file that's shared across the entirety of your website. Some of the top news sites in the world use this approach today. One news site, for example, has one style sheet with 4,000 rules in it, of which only 5-10 per cent are used in a single page. The browser has to download all these styles, pass them and create internal data structures, most of which will never be used.
12. Link your JavaScript at the bottom of the page
This is common best practice. You should always make sure that the styles and the visuals are downloaded first. That way, the JavaScript can follow later and manipulate the page how it likes. However, if you absolutely have to link the JavaScript in the header, as determined by the CRM system or hosting service you are using, then be sure to use the defer tag.
13. Understand the limits of HTML5 tags
New HTML5 tags like <section>, <header>, and <footer> improve the semantics of markup, but require a special shiv script to run in Internet Explorer 6, 7, and 8, or they won't be recognised. Pages that need to work with these legacy browsers, even when scripts are disabled, cannot use the new HTML5 tags. Using plain <div> elements and classes is often a safer course of action for those cases.
14. Standardize on a single framework
There are a lot of JavaScript frameworks out there and a many of them do the same things in terms of functionality. The browser has to download the JavaScript, pass it and create internal data structures without knowing whether or not you will execute them. By sticking to one, single framework, you will significantly improve your performance.
15. Don't include scripts to be cool
There are a lot of 'cool' scripts out there. It's really easy to include a script file that does something 'cool' in the background, but that script file is competing with resources in your page load. Are you sure it's necessary?
Optimize media usage
16. Minimize the number of images

The majority of bytes downloaded are for images. The average number of images on the top 100,000 websites is 58. When you go over 20-30 images, you'll start to see a performance impact. Take a look at all your resources and ask yourself whether you need them or not.
17. Use image sprites
Image sprites can significantly reduce the amount of data that needs to be downloaded. Where possible create image sprites by hand.
![]()
18. Consider which image formats you use
PNG offers the most efficient balance between compatibility, coding size, CPU decoding time and the bytes required for CPU decoding. It also has one of the best compression rates. However, for photographs, JPEG tends to be the better format.
19. Avoid complex SVG paths
Complex SVG paths take the browser a long time to download, pass and construct internal data structures. Where possible, try to generate the most concise SVG path you can. It may take a while, but generating the SVG path by hand really can help.

20. Specify an image preview for HTML5 video
If you don't specify an image preview, the browser has to download the video, figure out what the first frame is, and then display that to the user. By specifying an image preview the browser doesn't need to download the video, only the image. It only starts downloading the video when the user requests it.

21. Minimize media plug-in usage
Despite perceptions, most media plugins aren't as fast as HTML5 at running video. Furthermore, they'll compete with the application for resources.
Write fast JavaScript
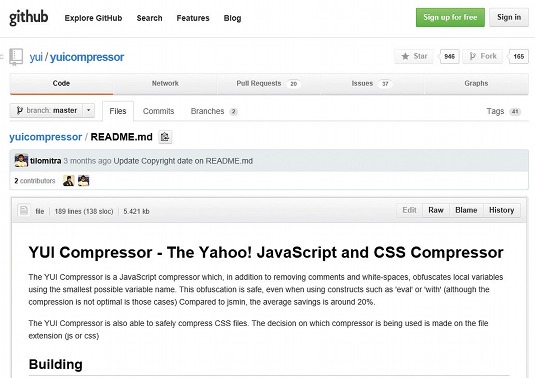
22. Minify your JavaScript
Many people will be familiar with this technique. Essentially, you take your JavaScript, remove some characters, and then simplify the variables. As demonstrated below:
Initial (66 characters)
-
function Sum(number1, number2) {
-
return (number1 + number 2);
-
}
Characters removed (54 characters)
-
function Sum(number1,number2){return
-
number1+number2;}
Compacted (30 characters)
-
function Sum(a,b){return a+b;}
You're left with less JS to download, and there's a hidden benefit: runtime performance. With tighter code and smaller variable names, the runtime can look up variables faster, improving download as well as runtime performance.
In addition, initialize JavaScript on demand. Don't load your entire JavaScript library during the page load – you can do it dynamically when you need to.
Render in standards mode
23. Use web standards
Not only does using web standards help reduce the cost of development and the complexity of testing across browsers and devices, but it can also achieve some noticeable performance benefits. In fact, we found that sites in IE10 got an average of 30 per cent better page load time when they switched to standards mode. The benefit is similar in IE9 too.

Standards mode is the default rendering mode of all browsers and offers the best implementation of web standards that work the same in all browsers. In addition to standards mode, IE provides compatibility modes to keep websites designed for old versions of IE working. This was particularly helpful in the past when it was a common practice to first detect a browser and then serve code meant only for it. But this is no longer necessary in many cases because the web standards code is displayed similarly in modern browsers, including IE10 and 9, through standards mode. This new practice is commonly known as feature detection and was made popular by Modernizr).
Monitor what your application is doing
24. Combine application timers
Most applications on the web today have 5-10 timers that are running at all times. About half of those timers are dormant. Make sure timers or sequences aren't running unnecessarily. When possible, combine your application timers and, if you can, create one timer that manages all your sequences.
25. Check your app's visibility status
Without knowing the visibility status of your application, you're forced to design it as always visible. Page visibility is a new standards-based API supported in IE10 and Windows Store apps, as well as most modern browsers.
Page visibility allows you to determine the visibility status of the application, so you can reduce activity when you know the application is not visible and, in doing so, save CPU time and increase battery life.
Conclusion
Better site performance can have a big impact on your users. Slow web page loading is a major factor in users abandoning a site, can reduce perceived site credibility and affect product sales. The time savings of some of the tips above may seem relatively small, but, when implemented together, they can create considerable time savings. What's more, they will encourage you to think efficiency first and create apps and sites with the user experience at the forefront.
Build 2012: 50 Performance Tricks to make your HTML5 apps and sites faster
Creating high performance web applications is crucial for every web developer, be it a web site that runs on a standards based web browser or a Windows Store App. Microsoft recently hosted the BUILD 2012 conference at the Microsoft campus in Redmond, WA. At this conference, I had the opportunity to share the Internet Explorer team’s favorite 50 performance tips to make HTML5 apps and sites faster. If you weren’t able to attend the conference, I recommend you check out the video.

Video link to the Build 2012 session: 50 Performance Tricks to make your HTML5 app and sites faster.
These performance tips and tricks apply equally to web sites that run on standards based web browsers, and Windows Store Apps, which are also just the web. There are six principals detailed in the talk that will help you improve the performance of your apps and sites today:
- Quickly response to network requests
- Minimize bytes downloaded
- Efficiently structure markup
- Optimize media usage
- Write fast JavaScript
- Know what your application is doing
I hope you enjoy the talk.
Thanks,
Jatinder Mann
Internet Explorer Performance Lab: reliably measuring browser performance
Matt, Jason and I wrote this article on the Building Windows 8 engineer blog on how the Internet Explorer team measures web browing performance. PC Magazine discusses the article as well. Enjoy!
A big part of this blog is going behind the scenes to show you all the work that goes into the engineering of Windows 8. In this post we take a look at something we all care very deeply about–as engineers and as end-users–real world web performance. We do a huge amount of work to get beyond the basics of anecdotes and feel as we work to build high performance web browsing. This post is authored by Matt Kotsenas, Jatinder Mann, and Jason Weber on the IE team, though performance is something that every single member of the team works on.
–Steven Sinofsky, President of Windows and Windows Live.
Web performance matters to everyone, and one engineering objective for Internet Explorer is to be the world’s fastest browser. To achieve this goal we need to reliably measure browser performance against the real world scenarios that matter to our customers.
Over the last five years we designed and built the Internet Explorer Performance Lab, one of the world’s most sophisticated web performance measurement systems. The IE Performance Lab collects reliable, accurate, and actionable data to inform decisions throughout the development cycle. We measure the performance of Internet Explorer 200 times daily, collecting over 5.7 million measurements and 480GB of runtime data each day. We understand the impact of every change to the product and ensure that Internet Explorer only gets faster. This blog post takes a deep look at how the IE Performance Lab is designed and how we use the lab to ensure we’re continually making the web faster.
In this post, we present:
- Overview of the IE Performance Lab
- Lab infrastructure
- What (and how) we measure
- Testing a scenario
- Results investigation
- Testing third-party software
- Building a fast browser for users
Overview of the IE Performance Lab
In order to reliably measure web performance over time, a system needs to be able to reproducibly simulate real world user scenarios. In essence, our system needs to create a “mini version of the Internet.”
The IE Performance Lab is a private network completely sealed from both the public Internet and the Microsoft intranet network, and contains over 140 machines. The lab contains the key pieces of the real Internet, including web servers, DNS servers, routers, and network emulators, which simulate different customer connectivity scenarios.
Although this may appear complex at first glance, this approach allows all sources of variance to be removed. By controlling every aspect of the network, down to individual packet hops and latencies, our tests become deterministic and repeatable, which is critical to making the results actionable. In the IE Performance Lab, activity is measured with 100 nanosecond resolution.

This type of network configuration also provides a great amount of flexibility. Because we’re simulating a real world setup, our lab can accommodate nearly any type of test machine or website content. The IE Performance Lab supports desktops, laptops, netbooks, and tablets with x86, x64, and ARM processors, all simultaneously.
Similarly, because the lab uses the Windows Performance Tools (WPT), we can run the same tests using different web browsers, toolbars, anti-virus products, or other third-party software and directly compare the results. WPT provides deep insight into the underlying hardware. Using WPT, we can capture everything from high-level CPU and GPU activity, to low-level information such as cache efficiency, networking statistics, memory usage patterns, and more. WPT allows us to measure and optimize performance across the stack to ensure that the hardware, device drivers, Windows operating system, and Internet Explorer are all efficiently optimized together.
A single test run takes 6 hours to complete and generates over 22GB of data during that time. This highly automated system is staffed by a small team that monitors operations, analyzes results, and develops new infrastructure features.
Lab infrastructure
The Performance Lab infrastructure can be broken into three main categories: Network and Server, Test Clients, and Analysis and Reporting. Each category is designed to minimize interaction across components, both to improve scalability of testing and to reduce the possibility of introducing noise into the lab environment.

Here’s a view of the IE Performance Lab, including a number of test and analysis machines on our private network.
Network and server infrastructure
Let’s start by discussing the DNS servers, network emulators, and content servers; all the components that together create the mini Internet. Over the next three sections we’ll work our way from right to left in the architectural diagram.
Content servers
Content servers are web servers that stand in for the millions of web hosts on the Internet. Each content server hosts real world web pages that have been captured locally. The captured pages go through a process we refer to as sanitization, where we tweak portions of the web content to ensure reproducible determinism. For example, JavaScript Date functions or Math.Random() calls will be replaced with a static value. Additionally, the dynamic URLs created by ad frameworks are locked to the URL that was first used by the framework.
After sanitization, content is served similarly to static content through an ISAPI filter that maps a hash of the URL to the content, allowing instantaneous lookup. Each web server is a 16-core machine with 16GB of RAM to minimize variability and ensure that content is in memory (no disk access required).
Content servers can also host dynamic web apps like Outlook Web Access or Office Web Apps. In these cases, the application server and any multi-tier dependencies are hosted on dedicated servers in the lab, just like real world environments.
Network emulators
Since many sources of variability have been removed, network speeds no longer reflect the experiences of many users with slower connections. To simulate real world customer environments, a test can take advantage of network emulation to understand the performance across the wide range of networks in use today. The lab supports emulating several DSL configurations, cable modems, 56k modems, as well as high-bandwidth, high-latency environments like WAN and 4G environments. As HTTP requests are passed to the emulator, it simulates network characteristics like packet delay and reordering, then forwards the request on to the web hosts. Upon receiving a response, emulation is again applied and then passed back to the test client.
Using dedicated hardware for network emulation provides the most realistic testing environment possible, and significantly reduces the observer effect. Although dedicated hardware adds cost and complexity compared to proxy or software-based solutions, it’s the only way to accurately measure performance. Browsers limit the number of simultaneous proxy connections to prevent proxy saturation, so using a proxy for network emulation has the unintended effect of sidestepping domain sharding and other optimizations made by the webpage. Additionally, local network emulation will compete with the browser for local machine resources, especially on low power machines.
DNS servers
Like real world DNS servers, the lab’s DNS servers link the content servers to the test clients. The lab also uses a different DNS server for each network emulator, meaning that changing from one network speed to another is as simple as changing the DNS server. In these cases, instead of resolving domain names to the web hosts, the DNS server resolves all domain names to the associated network emulator.
Test client configurations
We want to ensure that Internet Explorer consistently runs fast across all classes of computer hardware. The lab contains over 120 computers used to measure Internet Explorer performance. We refer to these as test clients; they range from high-end x64 desktops, to low-powered netbooks, to touch-first tablet devices, and everything in between. Because repeatability of measurements is paramount, all test clients are physical machines.

Internet Explorer Performance Lab change comparison machine pool
Different machine classes contain both discrete and integrated graphics platforms to ensure that Internet Explorer continues to take full advantage of hardware acceleration across the ecosystem of devices. Above is our main machine pool. These PCs approximate the average consumer experience over the lifetime of a Windows 7 or Windows 8 PC.
Machines are ordered from the OEM to be identical; they all come from the same manufacturing lot and their performance characteristics are verified prior to use. Since the lab runs 24/7, hardware failures are inevitable. Replacing failed components with identical parts from a different manufacturing lot almost always results in the repaired computer running faster than the other machines in the pool. While this difference would be unnoticeable in the real world, when you’re measuring down to 100 nanoseconds, even a few cycles can impact the results! If after a repair a machine no longer runs identically to the rest of the pool, it is removed from the lab and the pool’s size permanently shrinks. In response, the lab’s purchases include extra “buffer” machines, so that when a failed machine is removed from the pool, the excess capacity provides a cushion, and the lab’s operations are not affected.
To add hardware breadth, we have additional machine pools that run the spectrum of consumer scenarios. Good performance on these machines ensures that IE uses the underlying hardware effectively across the PC ecosystem.

Low-powered test machines. Each one is in a different state of testing.
If even more diversity is needed, the IE Performance Lab can also make use of the Windows Graphics Lab. The Windows Graphics Lab stocks nearly every graphics chipset manufactured. PCs can be configured into nearly any permutation imaginable and then used for performance testing. The Windows Graphics Lab is invaluable for diagnosing graphics problems across chipsets and driver revisions.
Analysis and reporting servers
Collection and analysis of test results are divided into two separate steps. By offloading analysis to dedicated machines, the test clients can begin another performance run earlier, and more powerful server class machines can be used to perform the analysis more rapidly. The sooner the analysis completes, the more efficiently we can identify performance changes.
For analysis, we use 11 server class machines, each of which has 16 cores and 16GB of RAM. During analysis, each trace file is inspected and thousands of metrics are extracted and inserted into a SQL server. Over the course of 24 hours these analysis machines will inspect over 15,000 traces that will be used for trend analysis.

Pictured are two of several server racks which contain file servers, a SQL server, and several analysis and content servers.
The SQL Server used to store the nearly 6 million measurements we collect each day is a 24 logical core machine with 64GB of RAM. Reports can be generated directly from SQL, or results can be inspected using either an HTML-based comparison application or WCF service that provides results in XML or JSON formats.
What (and how) we measure
With the infrastructure in place, let’s review the different types of scenarios measured in the Performance Lab, and the tools we use to gather metrics.
Scenarios measured daily
The Performance Lab focuses on real world scenarios that matter to users. As a result, we run over 20,000 different tests daily. These tests fall into four, sometimes overlapping, categories:

Loading content – Navigating from one page to another is still the
most common activity inside a web browser. Loading web content is also the only
category that touches most of the browser’s eleven subsystems. Loading web content is a prerequisite
for the other categories of scenarios.
Interactive web apps – This category covers what is sometimes referred
to as content creation, AJAX applications, or Web 2.0 sites. It includes interacting
with popular news and social networking sites as well as interacting with mail and document applications like Outlook Web Access and Office Web Apps.
IE “the application” – Important but often forgotten are scenarios that interact with the browser itself. Common interactions include opening or closing the browser, switching tabs, using browser features like History and Favorites, and panning and zooming with both keyboard and mouse, and touch inputs.
Synthetic benchmarks – Rarely forgotten but often overstated are synthetic benchmarks like WebKit SunSpider. Benchmarks can be a useful engineering tool as they are designed to stress individual browser subsystems and accentuate differences between browsers. However, in order to maximize those differences, benchmarks often resort to atypical usage patterns or edge cases.
Real world patterns
When measuring performance it is important to ensure that the tests reflect real world usage patterns. Most Software Engineering textbooks refer to this process as workload
modeling, or application usage modeling. To ensure that the Performance Lab measures real world patterns, the Performance Lab uses real Web pages that represent real world patterns and exercise different browser subsystems.
In order to determine which sites to use for testing, we regularly crawl millions of sites and compile a list of site attributes and coding patterns. We use 68 different data points to determine commonalities across sites – things like the depth and width of the resulting DOM, CSS layout patterns, common frameworks used, international features, and more. From the results we chose sites that best represent the common patterns and diversity of the broader Web.
Engineering metrics
Performance is a multi-dimensional problem. The only way to get an accurate view of performance is to understand the scenario you’re testing, and how the hardware and OS interact with the browser. Here’s a closer look at five important performance metrics in the context of loading a major sports site for the first time.

Display Time – Display Time measures the time from when the user performs an action until the user sees the result of that action on the screen.
Elapsed Time – Most sites continue to perform background work after content has been displayed to the screen. Examples might include downloading the next email in a web mail application or sending analytics back to a provider. From the user’s perspective, the site might appear finished; however, significant work is often occurring which can impact overall responsiveness.
CPU Time – Modern web browsers are almost exclusively limited by the speed of the CPU. Offloading work to the GPU and making the CPU more efficient makes a large impact on performance.
Resource Utilization – Building a fast browser means ensuring resources across the entire PC work well together, including network utilization, memory usage patterns, GPU processing, graphics, memory, and hundreds of other dimensions. Since users run several applications at the same time on their PCs, it’s important for browsers to responsibly share these resources with other applications.
Power Consumption – Increasing power efficiency leads to longer the battery life in mobile scenarios, lower electricity costs for the device, and a smaller environmental impact.
Concentrating only on a single metric creates an overly simplistic view of performance. By focusing on a single metric, humans naturally tend to optimize for that metric, often at the expense of other equally important metrics. The only way to combat that tendency is to measure all aspects of performance, and then make the tradeoffs consciously, rather than implicitly.
In total, the Performance Lab measures over 850 different metrics. Each one provides part of the picture of browser performance. To give a feel for what we measure, here’s a (non-exhaustive) list of key metrics: private working set, total working set, HTTP request count, TCP bytes received, number of binaries loaded, number of context switches, DWM video memory usage, percent GPU utilization, number of paints, CPU time in JavaScript garbage collection, CPU time in JavaScript parsing, average DWM update interval, peak total working set, number of heap allocations, size of heap allocations, number of outstanding heap allocations, size of outstanding heap allocations, CPU time in layout subsystem, CPU time in formatting subsystem, CPU time in rendering subsystem, CPU time in HTML parser subsystem, idle CPU time, number of threads.
Windows event tracing infrastructure
Metrics are gathered using Windows Event Tracing Infrastructure (ETW) and VMMap. ETW is the Windows-wide event logging system that is used by many Windows components and third-party applications, including the Windows Event Log. ETW logging APIs are extremely low level and low overhead, which is critical for performance testing.
")
The trace viewer included in WPT, xperfview.exe, is a powerful visualizer that allows correlation and overlaying kernel, CPU, GPU, I/O, networking, and other events. WPT also supports stack walking. Stack walking takes a snapshot of the program’s callstack at regular intervals and saves the stack as part of the trace. By correlating ETW events with stacks, WPT will display not only what work was being done, but the callstack associated with that work and the amount of time spent doing that work, with 10 microsecond resolution. Stack walking can be enabled on any process, even one that does not use ETW events. The drawback to stack walking is that it requires debugging symbols to decode the stacks, and is susceptible to aliasing.
Testing a scenario
The final piece of the puzzle is the actual test process. Testing can be broken into 3 phases: setup, testing, and errors and cleanup. Here’s a flowchart of the entire process to follow along.

Setup
The process starts when a user requests a run through the lab website or automation framework. The run is placed into a priority queue with other pending runs. When a test client becomes available, it checks the queue and starts the highest priority job that it can. First, the test client installs the Test OS specified. The IE Performance Lab supports testing on Vista, Windows 7, and Windows 8. The test client installs a fresh copy of the Test OS for every run so the machine always starts in a known
good state.
Once the Test OS is installed, the client configures WPT, VMMap, and the test harness. The run also specifies a number of IE settings such as the homepage, use of Suggested Sites, InPrivate browsing, and others. Any third-party software is also installed and configured at this point.
The final step before testing is ensuring that the test client is idle to minimize test interference. Windows defines a concept of idle tasks. Idle tasks are a way for Windows and other developers to schedule non-critical work to happen at a later time when the user is not competing for resources. OS idle tasks include prefetching or SuperFetching, disk defragmentation, updating search indexes, and others, depending on OS version and configured services. To ensure that no idle work is done during the tests, the idle task queue is flushed.
Additionally, Windows Defender is paused and the log location for the test harness is marked as excluded from the Windows Indexing Service to prevent log and trace files from causing the indexer to start during a test run. Testing is done in multiple passes to minimize the number of providers needed, since additional providers increase the observer effect. The first pass is always a warm-up pass. Warm-up ensures that the browser binaries are “warm” and that the maximum amount of cachable page content is available in the WinINET cache. Subsequent passes each focus on a specific type of instrumentation, like stack walking, memory tracing, and I/O and registry tracing.
Errors and cleanup
If at any time during the test the browser crashes, the test pass is considered failed and the run moves on to the next test pass. If at any time during the tests Windows crashes, the computer reboots and the OS is reinstalled, since its state cannot be guaranteed. If the number of retries exceeds the threshold, the whole run is considered failed and the machine moves on to another run to prevent endlessly trying to test an unstable build.
When all the test cases are complete, the test client uploads the logs and traces for analysis. The test client then returns to an idle state and begins polling for a new run.
Results investigation
Each metric is tracked change-over-change. We run each test case a minimum of ten times, and duplicate runs on at least two different machines to create the sample population. Using statistical tools, uncharacteristic results can be automatically flagged for investigation. A variance change is also considered a regression. Users interact with IE under a wide range of circumstances and on a wide range of hardware, and one of our goals is to ensure a smooth and predictable experience every time.
In addition to automated analysis, a triage team investigates the daily results to watch for trends and other interesting behaviors. Manual investigation cannot be eliminated because many statistical tools assume both a normal distribution and that all samples are independent.
Neither assumption may be strictly true for our measurements. Some activities in IE are driven by a timer from the OS, meaning results are also dependent on when (along the timer’s cycle) the page load begins. A page load that starts right before or after a timer interrupt may do more or less work because IE must service the interrupt at different points in the page-load process. This interruption can have a rippling affect that leads to a bimodal distribution. Also, because we use repeated trials (and we don’t wipe the machine between iterations) the next trial is influenced by previous trials. Here’s a sample Elapsed Time graph for Bing Maps for change-over-change comparison.
 on Bing Maps")
The red series shows the median value of each test run, and grey bars show the range. Hovering over a test run will show the iterations for the metric (in blue) as well as a tooltip that provides the exact values for minimum, median, max values, as well as the absolute and relative difference with the previous test run. The tooltip shown in this image also provides additional context like the build being tested, and a quick link to our source control system to view the changes in the build.
The combination of automated analysis and manual investigation provides the IE team with reliable and actionable data for performance tuning.
Testing third-party software
Many third-party applications depend on Trident, the network stack, and other IE components. Extensions like BHOs and toolbars load within the IE context. Other applications, like security software, can inject themselves between IE components. These applications become part of the IE stack, and can lead to poor performance. The Performance Lab is capable of measuring the impact of third-party software on browsing real world content in a controlled environment. These studies are important to IE and the ecosystem because users generally cannot quantify the impact of popular software on their browsing experience.
When testing third-party software impact, we compare a run with third-party software installed, with a clean run with only IE installed, to determine the impact of the software. In particular, we are interested in measuring two metrics: startup time and navigation time. Startup time measures the time it takes to launch the browser and navigate to an URL, whereas navigation time measures the time it takes to navigate to an URL when the browser has already been launched. Startup will also include the time that third-party applications take to load their IE extensions.
Using cached content allows repeatability in our measurements. Further, by measuring a cached site, we can definitively know that a performance regression is caused by the third-party software and not by differences in the site. Whenever measuring the impact of third-party software, we also validate our findings by testing startup and navigation on a direct connection to the Internet, to verify that the testing environment is not responsible for any deltas.
Many third-party applications offload work during a page navigation to cloud services. While parallelization of work and use of cloud services are excellent techniques to improve performance, some applications wait synchronously for the results from the network, blocking the navigation in the process. There are many real world scenarios, like strict firewalls, WAN connections, and offline scenarios, where such patterns can lead to poor performance for users. Third-party software should never process synchronously in response to an IE or user action, and should batch UI and DOM updates to minimize disruption.
Building a fast browser for users
Real world browser performance matters. Measuring performance at scale is a significant investment and a full-time job, but the results are well worth the effort. The data gathered by the Internet Explorer Performance Lab is instrumental in our understanding of browser performance and of the underlying PC hardware, and in developing a fast, fluid, and responsive web experience for users.
—Matt Kotsenas, Jatinder Mann, and Jason Weber for the Internet Explorer Performance Team
IEBlog: The Year in Review: W3C Web Performance Working Group
In this IEBlog article, I look back at a year in the W3C Web Performance Working Group:
17 Aug 2011 9:36 AM
Fast HTML5 Web applications benefit consumers who browse the Web and developers building innovative new experiences. Measuring performance characteristics of Web applications and writing efficient applications are two important aspects of making Web sites fast. Browser manufacturers can rapidly address developers’ needs through interoperable APIs when collaboratively partnering through the W3C.
One year ago today, the W3C announced the formation of a Web Performance Working Group chartered with two goals: making it easier to measure and understand the performance characteristics of Web applications and defining interoperable methods to write more CPU- and power-efficient applications.
Together with Google, Mozilla, Facebook, and other industry and community leaders who participate in the W3C Web Performance Working Group, we designed the Navigation Timing, Resource Timing, User Timing and Performance Timeline specifications to help developers accurately measure Web application performance. The first three specifications, Navigation Timing, Resource Timing, and User Timing, define interfaces for Web applications to access timing information related to the navigation of the document, resources on the page, and developer scripts, respectively. The Performance Timeline specification defines a unifying interface to retrieve this timing data.
Resource Timing, User Timing, and Performance Timeline specifications are all in the Last Call phase of specification. Last Call is a signal that the working group believes the spec is functionally complete and is ready for broad review from both other working groups and the public at large. This Last Call period extends until September 15, 2011. The Navigation Timing specification is already in the Candidate Recommendation phase and has two interoperable implementations, starting with Internet Explorer 9 and Chrome 6. Together these APIs help Web developers create faster and more efficient applications by providing insights into the performance characteristics of their applications that just weren’t possible before.
Over the last four months, the Web Performance Working Group defined interoperable methods to write more CPU- and power-efficient applications by producing the Page Visibility, Timing control for script-based animations, and Efficient Script Yielding specifications. The Page Visibility specification is in the Last Call phase until September 8th and has two implementations starting with the second IE10 Platform Preview and Chrome 13. The requestAnimationFrame API, from the Timing control for script-based animations specification, has three implementations starting with the second IE10 Platform Preview, Firefox 4 and Chrome 10. This specification is very close to entering Last Call. For more information on these two APIs, see the blog posts on using PC Hardware more efficiently with these APIs (link and link). IE10 is the first browser to implement the emerging setImmediate API from the Efficient Script Yielding specification.
It’s encouraging to see how much progress we’ve collectively made in just one year. These APIs are a great example of how quickly new ideas can become interoperable standards that developers can depend on in modern HTML5-enabled browsers. Thanks to everyone in the W3C Web Performance Working Group for helping design these APIs and to other browser vendors for starting to implement these APIs with an eye towards interoperability.
—Jatinder Mann, Program Manager, IE Performance
